Author: Sanjay Somanath, Alexander Hollberg, Liane Thuvander
Date: April 2021
Subtitle : A platform for collaborative decision making and stakeholder engagement.
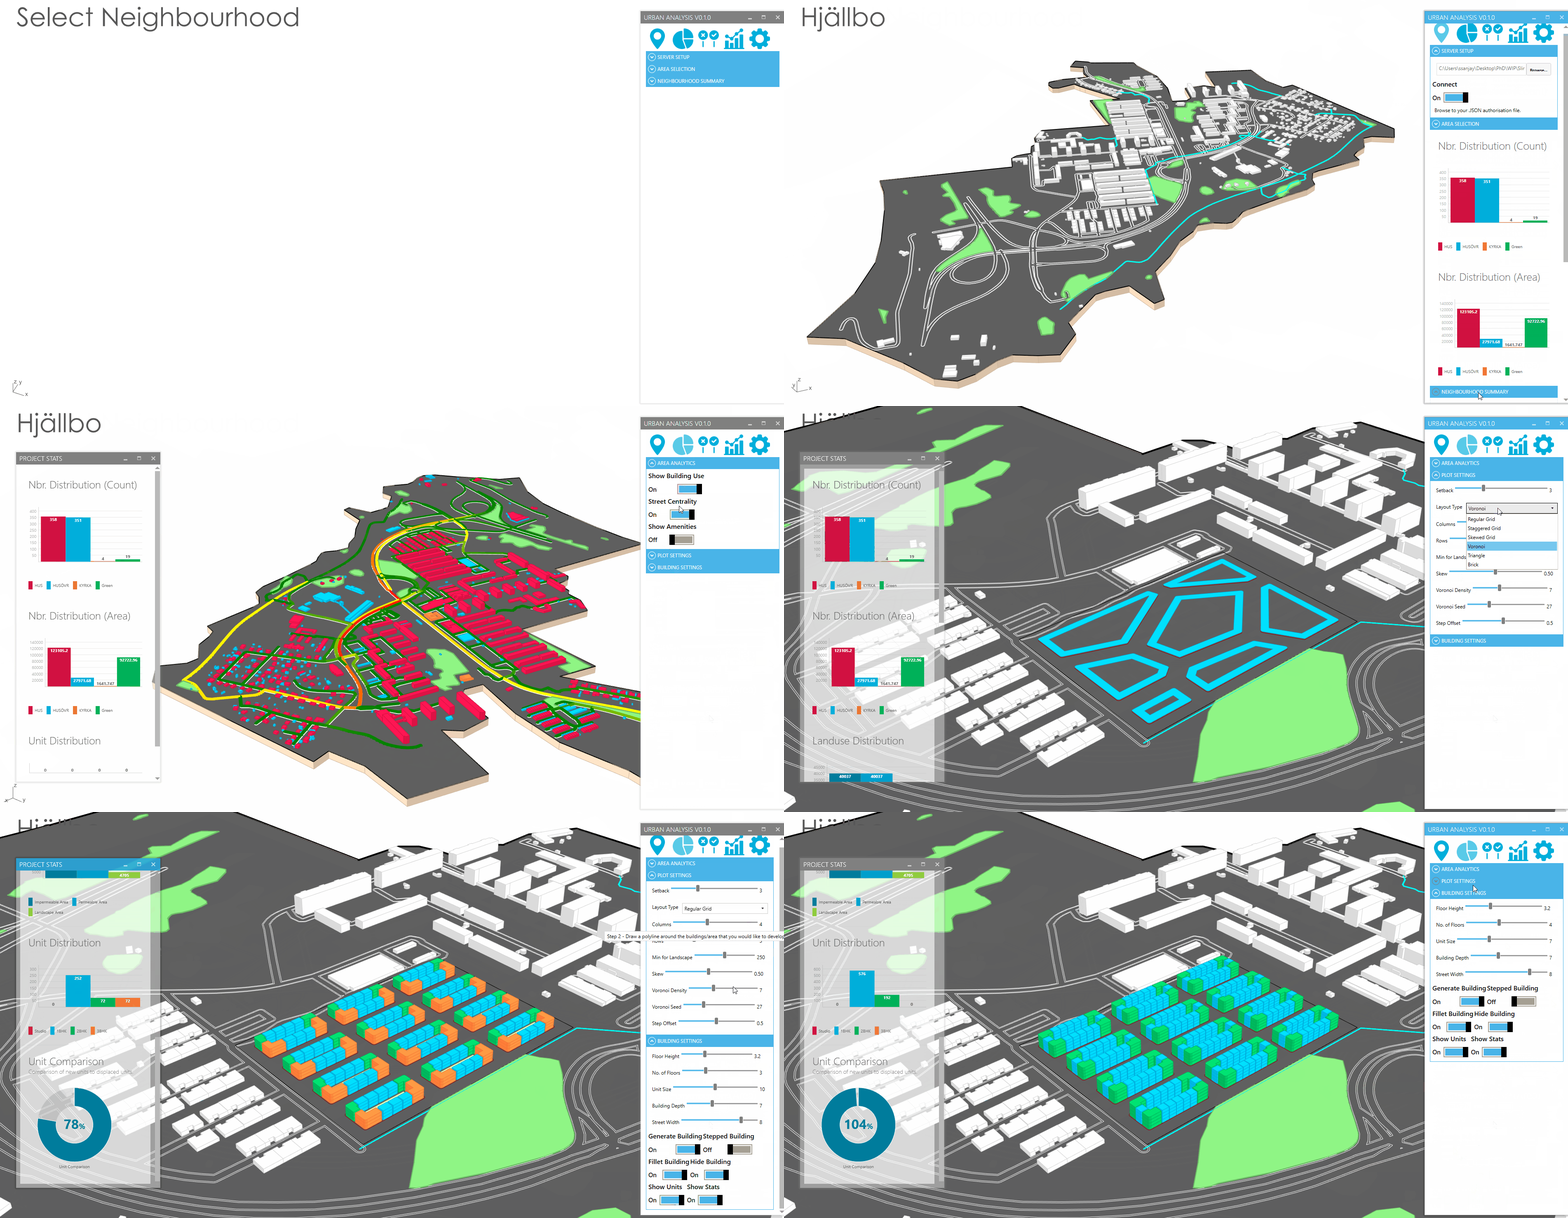 Figure : Contextual data fetched from local PostGIS server (Presented at ACT! Sustainability conference - 2020)
Introduction
Digital tools for performance-assessment are commonly used to shorten the feedback loop in testing designs for buildings
and neighbourhoods. However, these tools do not extend to the social dimension in the same way as the economic and
environmental dimensions.
This project aims to develop a theoretical understanding of social sustainability at the neighbourhood planning level
and propose a model for digital tools development. We then implement this model by building a digital platform that
addresses the theoretical and operational challenges in pursuing social sustainability at the neighbourhood planning
level. The tool is aimed at architects and urban planners, who would then incorporate stakeholder choices and values
into the design process.
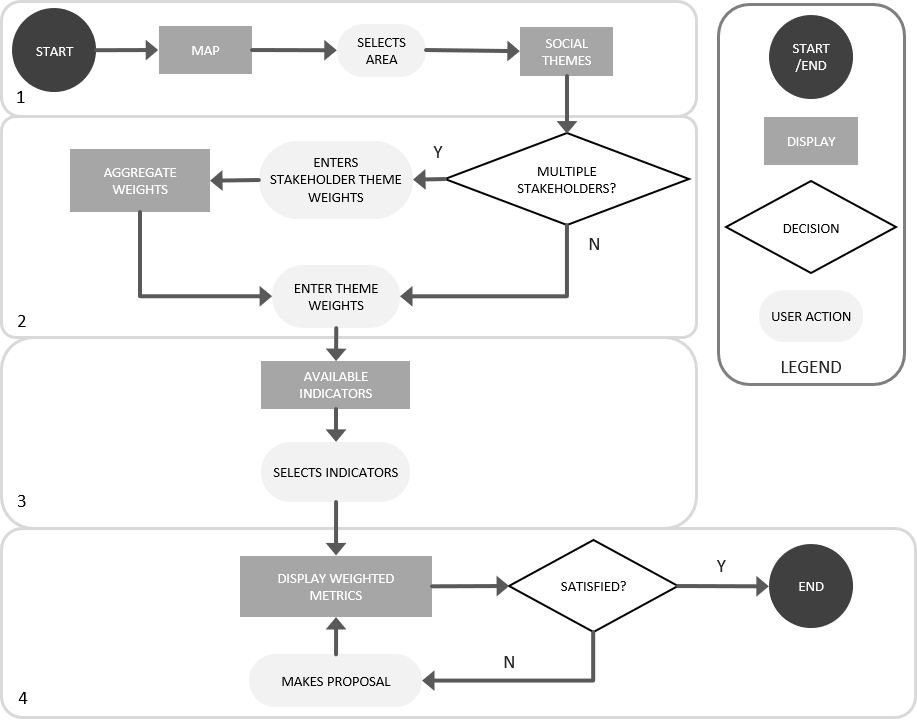
Figure : A digital tool framework as proposed in Somanath et al. (2021)
Key Features
Collaborative input
Consideration of stakeholder values is crucial to answering the question “social sustainability for whom?”. We propose
an information pipeline that allows stakeholders to assess the social sustainability framework and weight their priorities.
The SoSu framework comprises of Social equity themes (amenities, community infrastructure, recreation and open space,
connectivity, jobs and housing) and Social Capital themes (interaction, participation, stability of the community,
sense of attachment and safety).
The stakeholders access the tool over a web-browser and provide their inputs. Bi-directional communication with the
design software is made possible through web sockets.
Indicator Selection
Multiple stakeholders can provide their inputs through the stakeholder portal. After the weighting process, the user can
select a preferred urban planning framework such as Social Return on Investment (SROI) Methodology, Hyper Locality or
Walkability/bikeability. Based on the urban planning framework selected, a list of available indicators inherits the weights
from their respective social themes. A planning scenario can then be run through the analytical engine and communicate
performance metrics to the stakeholders. Through this whole process, the user can expose additional variables within
the design process to the stakeholders.

Figure : Bi-directional communication of stakeholder input and performance output on the web.
Contextual Data and Multiple Data Sources
Over recent years, open data initiatives have made many contextual information layers available to the public. However, this data is located in different locations and different data formats. In this project, we have developed a data pipeline that can link and combine this data and stream it into the user’s design software. Using a guided decision-making process, the user can incorporate multiple datasets from different sources (e.g. Lantmateriet, Trafikverket and SCB) to develop a rich understanding of the local context.
Tool interface
Sanjay Somanath, Alexander Hollberg & Liane Thuvander (2021)
Towards digitalisation of socially sustainable neighbourhood design,
Local Environment,
DOI :10.1080/13549839.2021.1923002
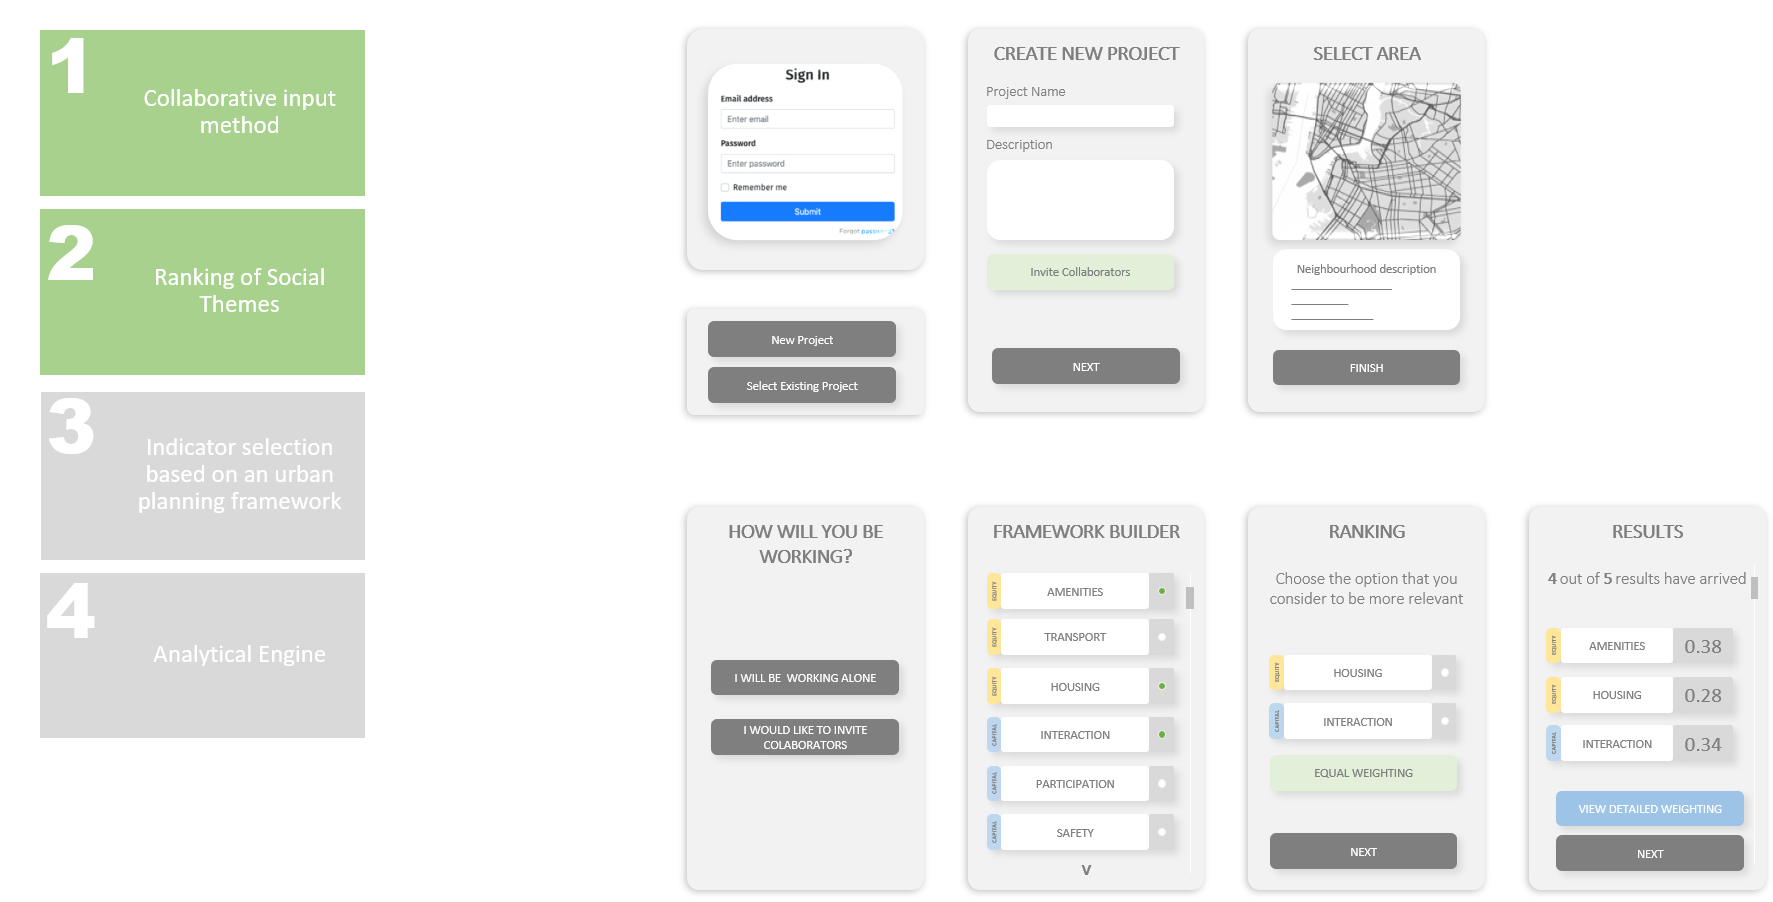 Figure : (Mock UI) Steps for a collaborative digital tool for socially sustainable neighbourhood planning.
Analytical Engine - TripSender
To narrow the project’s scope and refine elements of collaborative-input, ranking, and the analytical engine, feedback
from active problem owners is crucial. Problem owners may be any municipalities, developers, building portfolio owners
in active development projects, existing or new in the region of Gothenburg.
Our aim with this project is to ensure that decision-making to support social sustainability is not out of a user’s
reach due to data availability or technical capabilities.
The generateTrips function from the tripsender module takes data from two a number of live sources and generates
trips for all agents in the model.
TripSender Documentation
Read the documentation here
Input
areaName - The name of the area with first alphabet capitalised. type(str)
popPerc - A decimal percentage for the population to be used. type(float)
Output
A keplerGL map type(keplergl.GL)
Output
Run the function and follow the instructions on the prompt.
Typing H in the menu will open up a list of neighbourhood names.
The names have not all been tested yet though. Note: First alphabet
must be capitalised and swedish characters must be used where required.
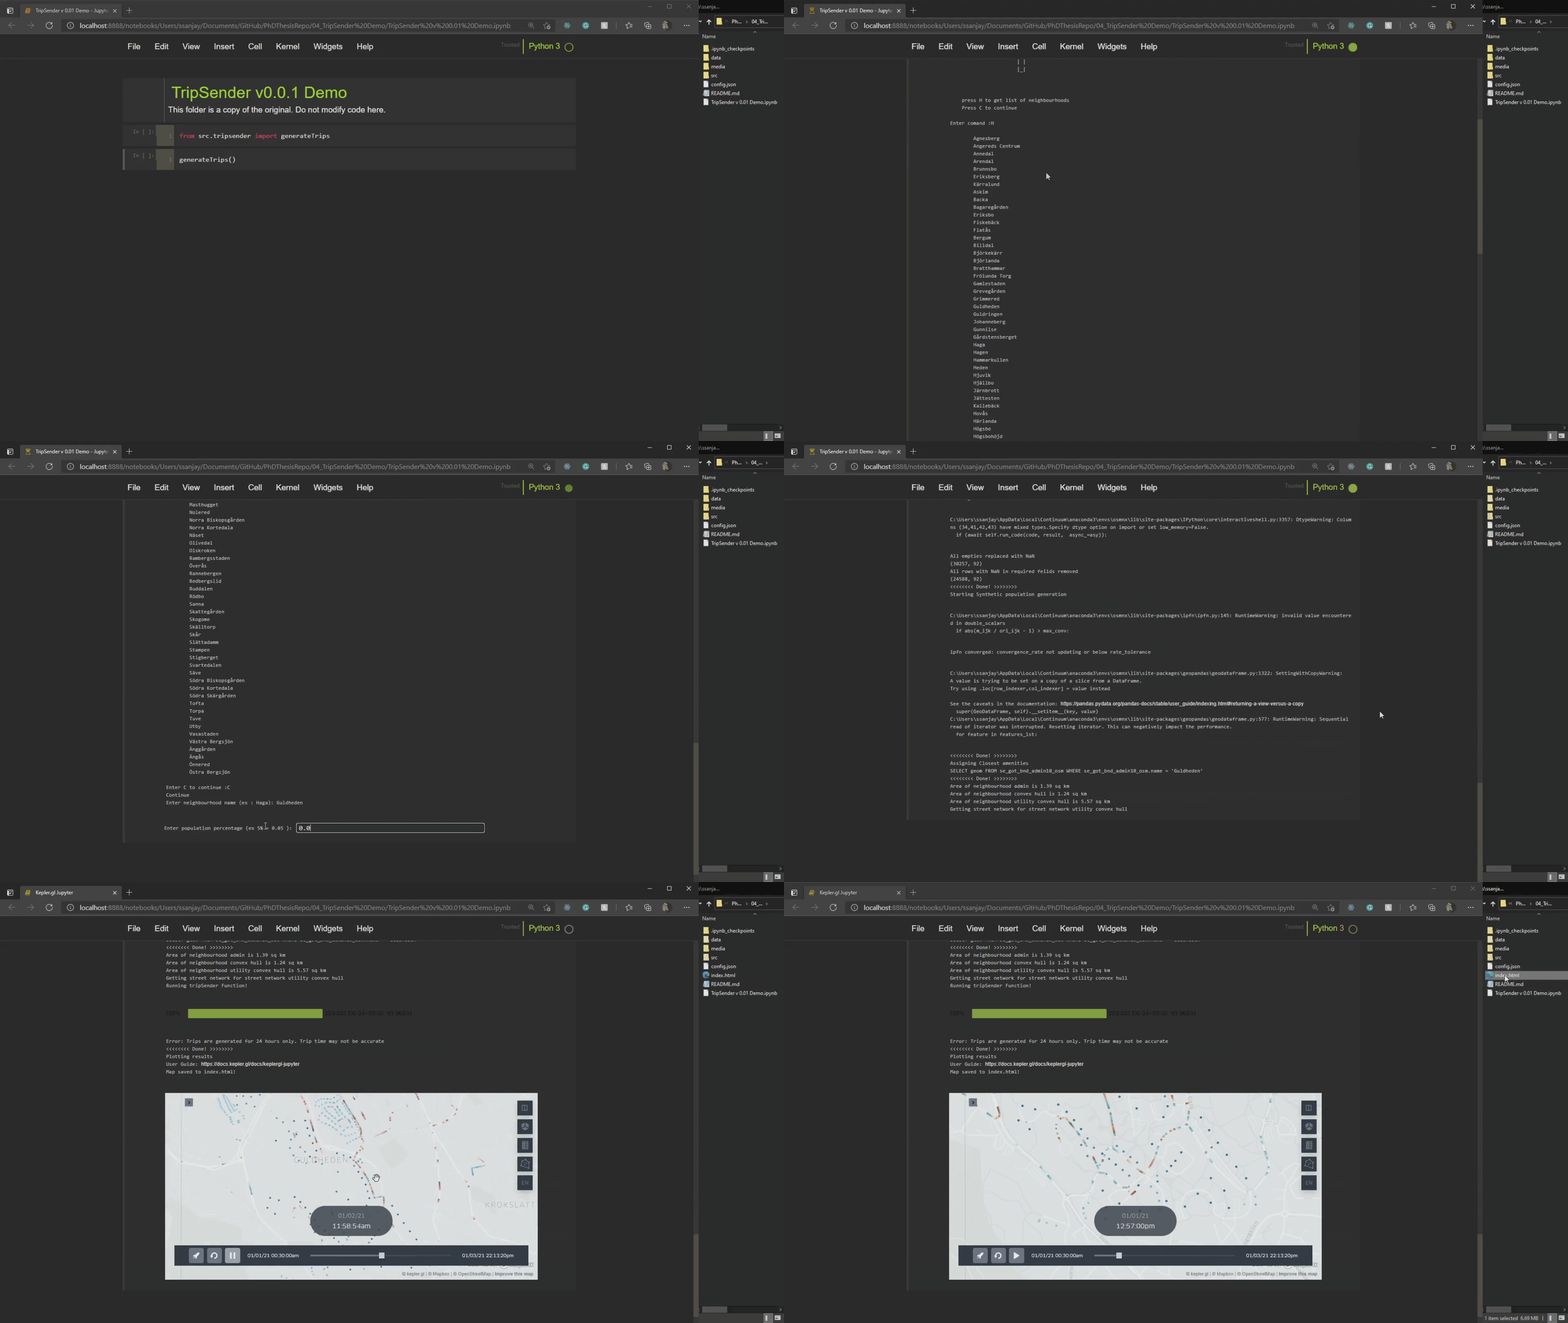 Figure : TripSender Results
Export
The function will also automatically export an index.html once done. This is
a keplerGL formatted html with the data hardcoded within the html file.
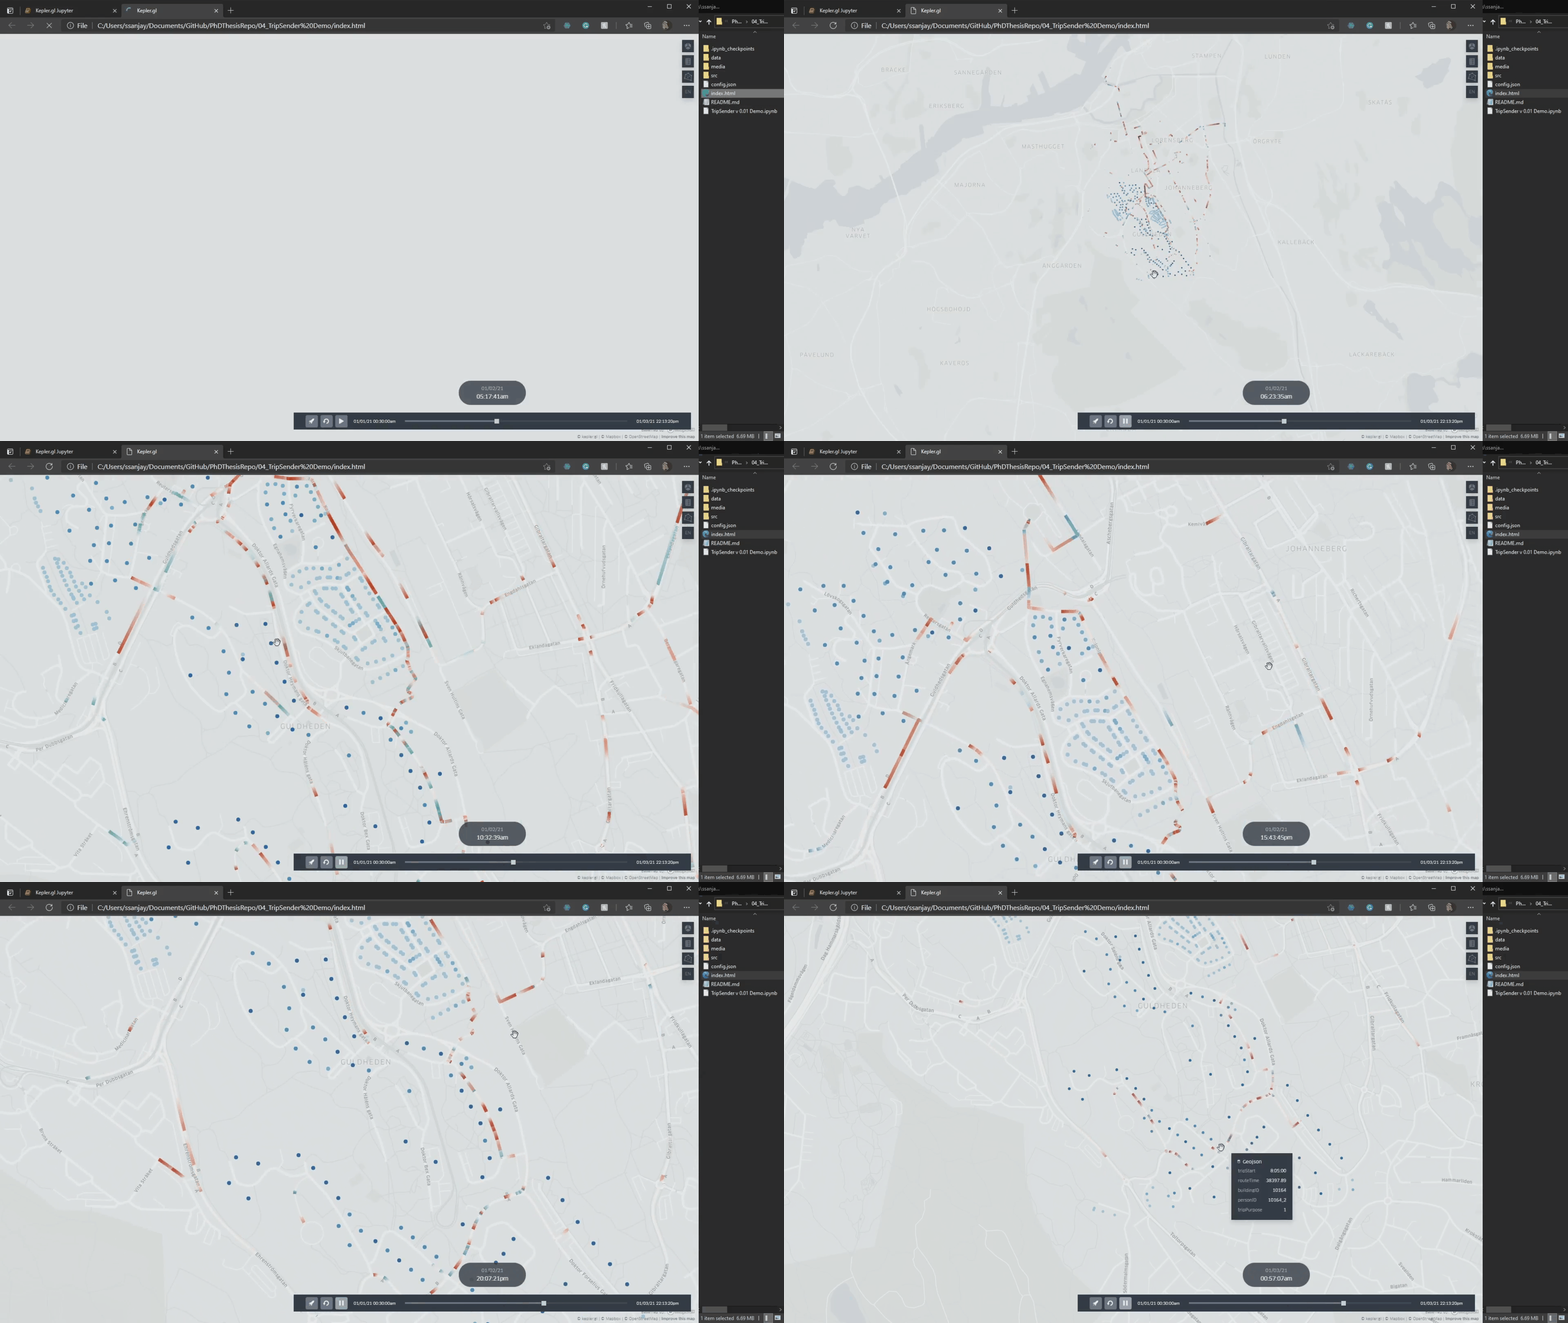 Figure : Figure Caption
Aggregating Data
The results of the tripsender function can then be aggregated at different levels.
This is still a work-in-progress.
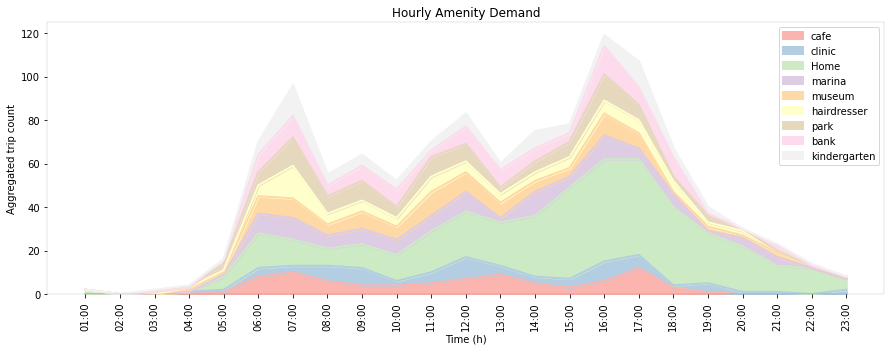 Figure : (Mock Data) Aggregated amenity demand over a 24-hour period.
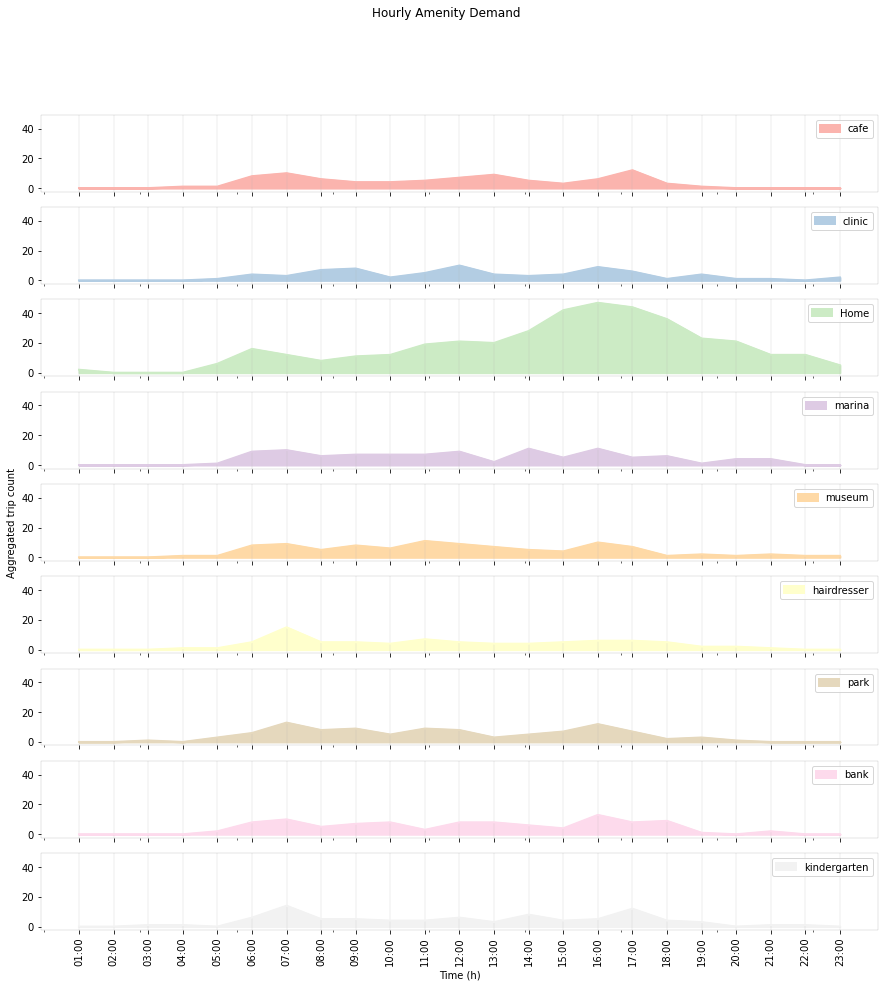 Figure : (Mock Data) Amenity demand for each amenity over a 24-hour period.
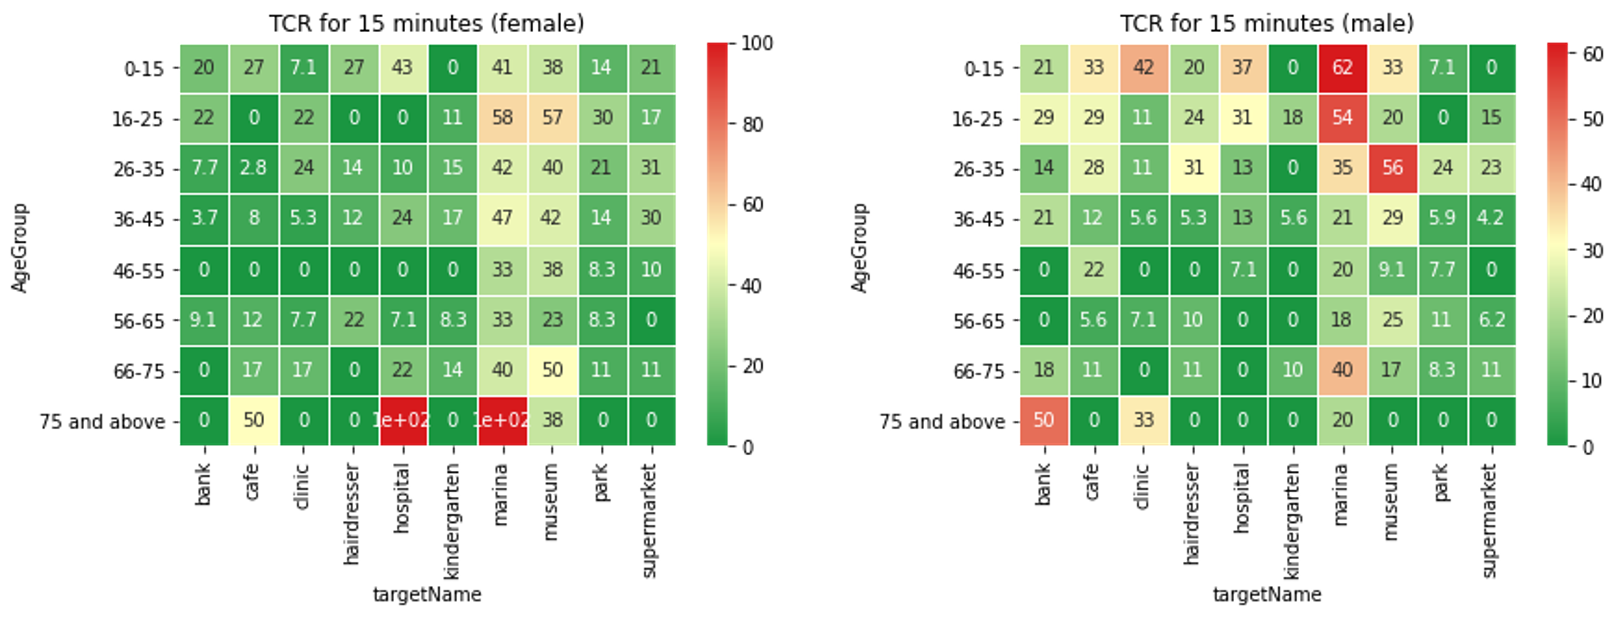 Figure : (Mock Data) TCR for male and female agents in the selected neighbourhood
Repo Details
Building the PostGIS server
Coming soon…
Building the project
git clone <repo>
cd <repo>
pip install venv
python3.8 -m venv my_venv
my_venv\Scripts\activate.bat
pip install -r requirements.txt
Open demo notebooks and run all.
Refresh ignored files
Ensure you commit everything before running this.
git rm -rf --cached .
git add .
git commit -m "refreshed ignored files."
